Data Visualization - Geo#
import urllib.request
import json
import pandas as pd

propertyid = "Property:P856"
url = (
    "https://www.wikidata.org/w/api.php?action=query&prop=revisions&titles="
    + propertyid
    + "&rvprop=timestamp|comment|ids&rvlimit=500&format=json"
)
response = urllib.request.urlopen(url)
responsedata = json.loads(response.read().decode("utf-8"))
array = []

for data in responsedata["query"]["pages"]:
    for revision in responsedata["query"]["pages"][data]["revisions"]:
        print(revision.keys())
        break
dict_keys(['revid', 'parentid', 'timestamp', 'comment'])
result = list(responsedata["query"]["pages"].values())[0]
revisions = result["revisions"]
revision = result["revisions"][0].keys()
revision
dict_keys(['revid', 'parentid', 'timestamp', 'comment'])
array = []

for revision in revisions:
    array.append([revision["timestamp"], revision["comment"]])
array[:1]
[['2024-07-11T17:55:27Z',
  '/* wbsetclaim-update:2||1|1 */ [[Property:P2302]]: [[Q21510851]]']]
dataframe = pd.DataFrame(array, columns=["timestamp", "modification"])
dataframe['timestamp'] = pd.to_datetime(dataframe['timestamp'], format='%Y-%m-%dT%H:%M:%SZ')
dataframe = dataframe.astype(
    dtype={"modification": "<U1000"}
)

dataframe["timestamp"] = pd.to_datetime(
    dataframe["timestamp"],
    format="%d/%m/%Y",
    unit="D",
    errors="raise",
).dt.normalize()
dataframe
| timestamp | modification | |
|---|---|---|
| 0 | 2024-07-11 | /* wbsetclaim-update:2||1|1 */ [[Property:P230... |
| 1 | 2024-07-03 | /* wbsetclaim-update:2||1|1 */ [[Property:P230... |
| 2 | 2024-07-03 | /* wbsetclaim-update:2||1|7 */ [[Property:P230... |
| 3 | 2024-06-19 | /* wbsetaliases-add:5|mzn */ وبسایت, وبگاه, سا... |
| 4 | 2024-06-19 | /* wbsetlabel-add:1|mzn */ رسمی سایت |
| ... | ... | ... |
| 495 | 2020-03-10 | /* wbsetlabel-add:1|mi */ pae tukutuku |
| 496 | 2020-03-08 | /* wbsetclaim-update:2||1|2 */ [[Property:P230... |
| 497 | 2020-03-08 | /* wbsetclaim-update:2||1|2 */ [[Property:P230... |
| 498 | 2020-03-08 | /* undo:0||1131502789|Trade */ I suggest a bot... |
| 499 | 2020-03-08 | /* wbsetclaim-create:2||1 */ [[Property:P2302]... |
500 rows × 2 columns
group = dataframe.groupby("timestamp").agg("count").reset_index()
group
| timestamp | modification | |
|---|---|---|
| 0 | 2020-03-08 | 4 |
| 1 | 2020-03-10 | 1 |
| 2 | 2020-03-14 | 1 |
| 3 | 2020-03-16 | 7 |
| 4 | 2020-03-17 | 5 |
| ... | ... | ... |
| 234 | 2024-05-28 | 1 |
| 235 | 2024-06-04 | 2 |
| 236 | 2024-06-19 | 2 |
| 237 | 2024-07-03 | 2 |
| 238 | 2024-07-11 | 1 |
239 rows × 2 columns
group.describe()
| timestamp | modification | |
|---|---|---|
| count | 239 | 239.000000 |
| mean | 2022-05-10 12:51:12.803347200 | 2.092050 |
| min | 2020-03-08 00:00:00 | 1.000000 |
| 25% | 2021-04-08 12:00:00 | 1.000000 |
| 50% | 2022-07-06 00:00:00 | 1.000000 |
| 75% | 2023-05-19 12:00:00 | 2.000000 |
| max | 2024-07-11 00:00:00 | 64.000000 |
| std | NaN | 4.456124 |
group.dtypes
timestamp       datetime64[ns]
modification             int64
dtype: object
group.modification.max()
np.int64(64)
group.modification.min()
np.int64(1)
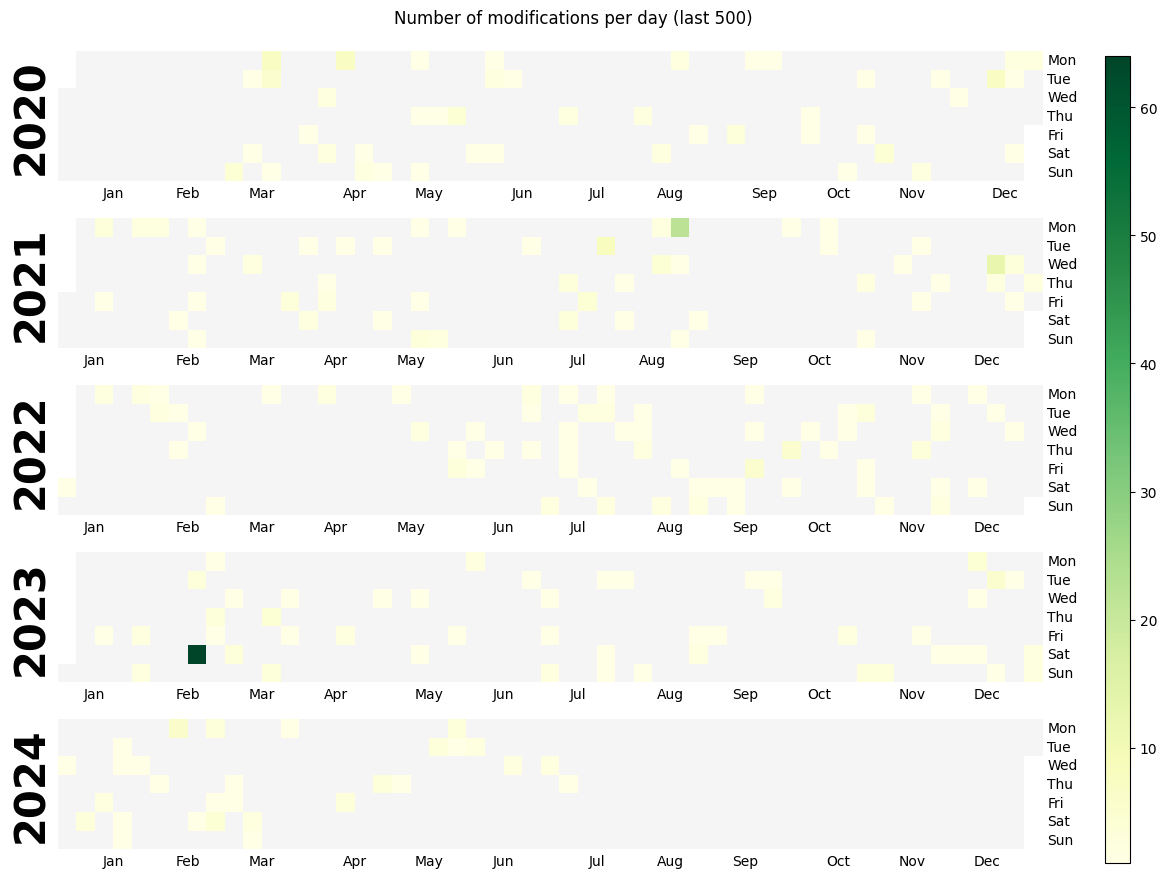
import calplot

days = group["timestamp"]

events = pd.Series(list(group["modification"]), index=days)
calplot.calplot(
    events,
    cmap="YlGn",
    yearlabel_kws={"color": "black"},
    linewidth=0,
    suptitle="Number of modifications per day (last 500)",
)
findfont: Font family 'Helvetica' not found.
findfont: Font family 'Helvetica' not found.
findfont: Font family 'Helvetica' not found.
findfont: Font family 'Helvetica' not found.
findfont: Font family 'Helvetica' not found.
findfont: Font family 'Helvetica' not found.
(<Figure size 1250x850 with 6 Axes>,
 array([<Axes: ylabel='2020'>, <Axes: ylabel='2021'>,
        <Axes: ylabel='2022'>, <Axes: ylabel='2023'>,
        <Axes: ylabel='2024'>], dtype=object))
findfont: Font family 'Helvetica' not found.
findfont: Font family 'Helvetica' not found.
findfont: Font family 'Helvetica' not found.
findfont: Font family 'Helvetica' not found.
findfont: Font family 'Helvetica' not found.
findfont: Font family 'Helvetica' not found.
findfont: Font family 'Helvetica' not found.
findfont: Font family 'Helvetica' not found.
findfont: Font family 'Helvetica' not found.
findfont: Font family 'Helvetica' not found.
findfont: Font family 'Helvetica' not found.
findfont: Font family 'Helvetica' not found.
findfont: Font family 'Helvetica' not found.
findfont: Font family 'Helvetica' not found.
findfont: Font family 'Helvetica' not found.
findfont: Font family 'Helvetica' not found.
import plotly.express as px

fig = px.histogram(
    group,
    x="timestamp",
    y="modification",
    nbins=20,
    labels={"x": "month", "y": "count"},
)
fig.update_layout(bargap=0.2)
fig.show()
import plotly.express as px

fig = px.scatter(
    group, x="timestamp", y="modification", labels={"x": "month", "y": "count"}
)
fig.update_layout(bargap=0.2)
fig.show()
import plotly.express as px

fig = px.histogram(group, x="modification", histnorm="probability density", nbins=20)
fig.update_layout(bargap=0.2)
fig.show()
import sys
from SPARQLWrapper import SPARQLWrapper, JSON

endpoint_url = "https://query.wikidata.org/sparql"

query = """SELECT ?heritagesite ?label ?coordinates {
  ?heritagesite wdt:P1435 wd:Q9259;
        wdt:P17 wd:Q142;
        rdfs:label ?label;
        wdt:P625 ?coordinates.
        FILTER (lang(?label)="en")
}
LIMIT 100
"""


def get_results(endpoint_url, query):
    user_agent = "WDQS-example Python/%s.%s" % (
        sys.version_info[0],
        sys.version_info[1],
    )
    sparql = SPARQLWrapper(endpoint_url, agent=user_agent)
    sparql.setQuery(query)
    sparql.setReturnFormat(JSON)
    return sparql.query().convert()


results = get_results(endpoint_url, query)

array = []
for result in results["results"]["bindings"]:
    array.append(
        [
            result["heritagesite"]["value"],
            result["label"]["value"],
            result["coordinates"]["value"],
        ]
    )
from shapely import wkt
import geopandas as gp

dataframe = pd.DataFrame(array, columns=["ID", "label", "coordinates"])
dataframe["coordinates"] = dataframe["coordinates"].apply(wkt.loads)

geodataframe = gp.GeoDataFrame(dataframe, geometry="coordinates")
array[:1]
[['http://www.wikidata.org/entity/Q8399',
  'Vieux Lyon',
  'Point(4.828056 45.763056)']]
geodataframe.dtypes
ID               object
label            object
coordinates    geometry
dtype: object
import folium

map = folium.Map(location=[45.1093, 2.6753], zoom_start=6)
geo_df_list = [[point.xy[1][0], point.xy[0][0]] for point in geodataframe.geometry]
i = 0
for coordinates in geo_df_list:
    map.add_child(
        folium.Marker(
            location=coordinates,
            icon=folium.Icon(color="green"),
            popup="Wikidata: <a target='_blank' href='"
            + str(geodataframe.ID[i])
            + "'>"
            + str(geodataframe.label[i]),
        )
    )
    i = i + 1

map
Make this Notebook Trusted to load map: File -> Trust Notebook