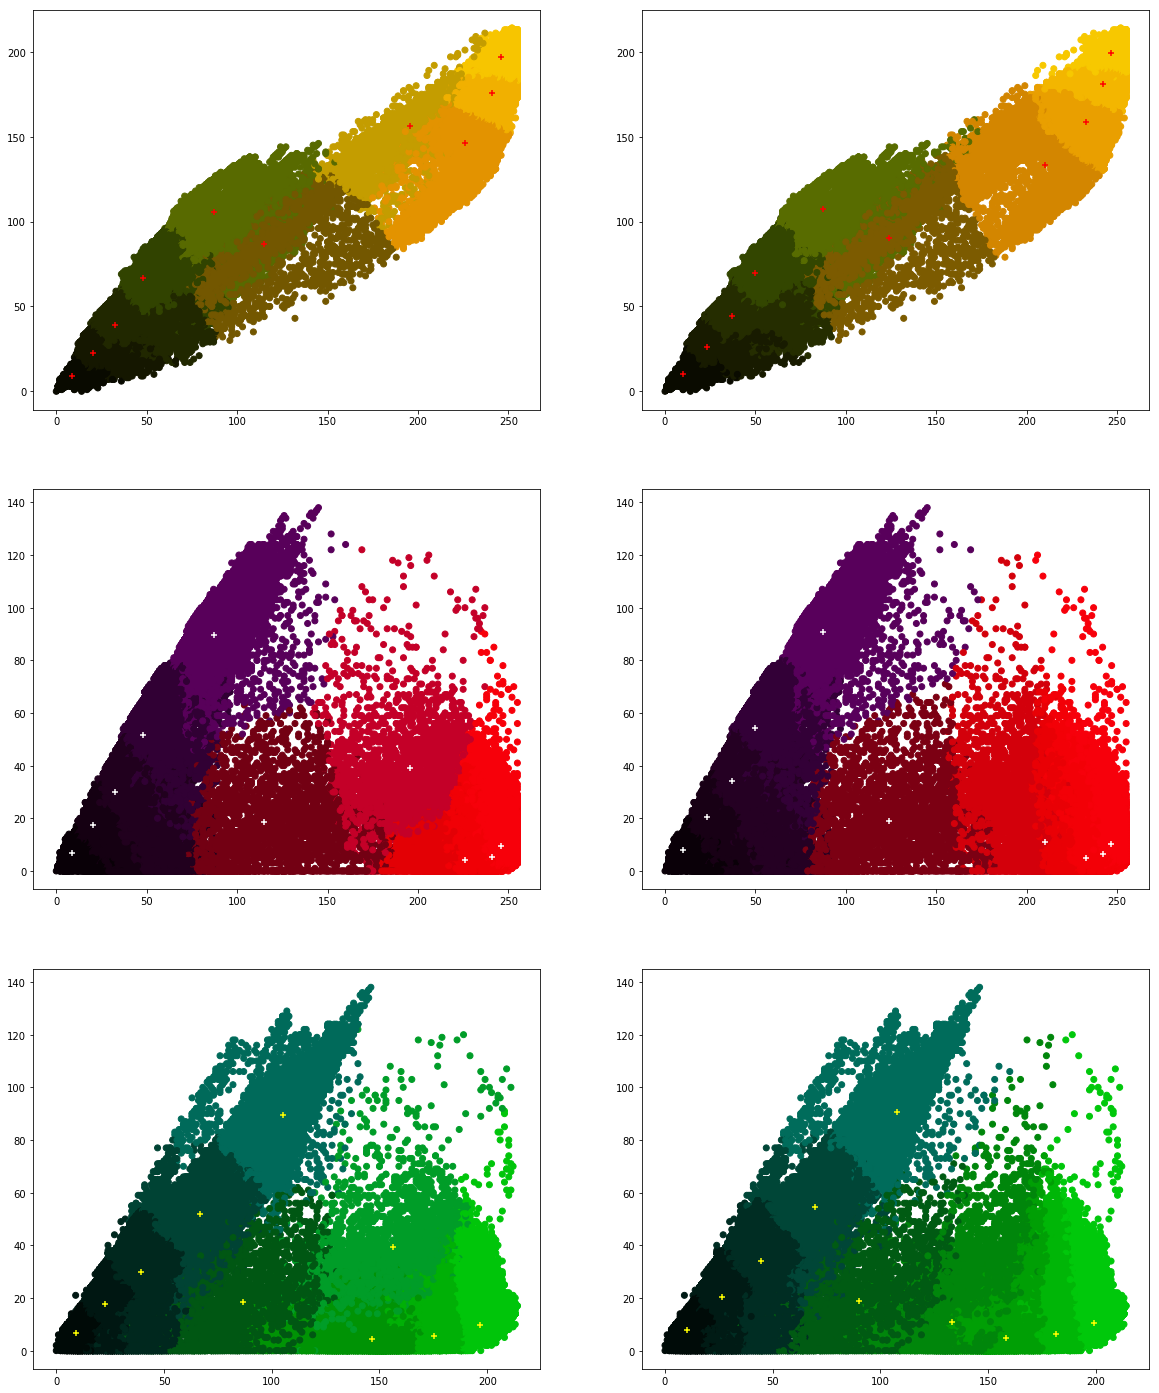
Data Mining

John Samuel
CPE Lyon

Year: 2019-2020
Email: john(dot)samuel(at)cpe(dot)fr
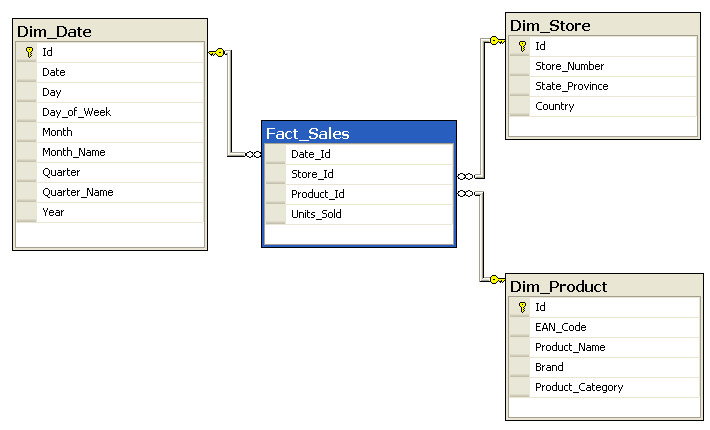
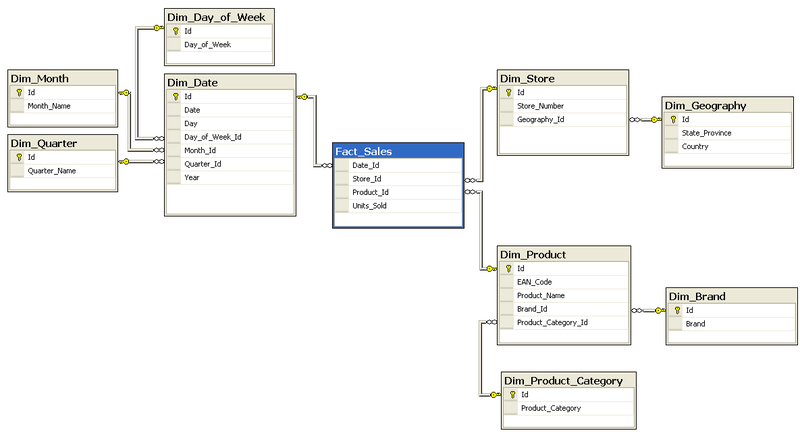
Creative Commons License

Data Mining

Goals

1. Lifecycle of data

Lifecycle of Data

  1. Data
  2. Knowledge
  3. Insights
  4. Actions
Data Lifecycle

1. Lifecycle of data

1.1. From Data to Knowledge

  1. Data acquisition
  2. Data Extraction
  3. Data Cleaning
  4. Data Transformation
  5. Data analysis modeling
  6. Data Storage
  7. Analysis
  8. Visualisation
Major steps of data analysis

1. Lifecycle of data

1.1.1. Data Acquistion

1. Lifecycle of data

1.1.2. ETL (Extraction Transformation and Loading)

  1. Data Extraction
  2. Data Cleaning
  3. Data Transformation
  4. Loading data to information stores
ETL (Extraction, Transformation and Loading)

1. Lifecycle of data

1.1.3. Data Analysis

1.1.3. Data analysis

1. Lifecycle of data

1.1.4. Data Visualization

1. Lifecycle of data

1.1.4. Data Visualization

2. Data Acquistion and Storage

2.1. Data acquisition

  1. Surveys
    • Manual surveys
    • Online surveys
  2. Sensors1
    • Temperature, pressure, humidity, rainfall
    • Acoustic, navigation
    • Proximity, presence sensors
  3. Social networks
  4. Video surveillance cameras
  5. Web
  1. https://en.wikipedia.org/wiki/List_of_sensors

2. Data Acquistion and Storage

2.2. Data storage formats

2. Data Acquistion and Storage

2.2 Types of data stores

  1. Structured data stores
    • Relational databases
    • Object-oriented databases
  2. Unstructured data stores
    • Filesystems
    • Content-management systems
    • Document collections
  3. Semi-structured data stores
    • Filesystems
    • NoSQL data stores
Unstructured vs. Structured vs. Semi-structured

2. Data Acquistion and Storage

2.3.1. ACID Transactions1

  1. https://en.wikipedia.org/wiki/ACID

2. Data Acquistion and Storage

2.3.1. ACID Transactions

2. Data Acquistion and Storage

2.3.2. Types of data stores

2. Data Acquistion and Storage

2.3.3. NoSQL

2. Data Acquistion and Storage

2.3.3. Types of NoSQL stores

3. Data Extraction and Integration

3.1. Data extraction techniques

3. Data Extraction and Integration

3.2. Query interfaces

3. Data Extraction and Integration

3.3. Crawlers for web pages

Web crawlers: navigating the entire using hyperlinks

3. Data Extraction and Integration

3.4. Application Programming Interface (API)

API (Interface de programmation)

4. Pre-treatement of Data

4.1 Data Cleaning: Types of Errors

4. Pre-treatement of Data

4.1.1. Syntactical errors

4. Pre-treatement of Data

4.1.2. Semantic errors

4. Pre-treatement of Data

4.1.3. Coverage errors

4. Pre-treatement of Data

4.2.1. Handling Syntactical errors

4. Pre-treatement of Data

4.2.2. Handling Semantic errors

4. Pre-treatement of Data

4.2.3. Handling Coverage errors

4. Pre-treatement of Data

4.2.4. Administrators and handling errors

5. Data Transformation

5.1 Languages

6. ETL

6.1. ETL (Extraction Transformation and Loading)

  1. Data Extraction
  2. Data Cleaning
  3. Data Transformation
  4. Loading data to information stores

6. ETL

6.2.1. Models for data analysis

6. ETL

6.2.1. Models for data analysis

6. ETL

6.2.3. Star Schema

6. ETL

6.2.3. Data Cubes

6. ETL

6.2.4. Snow Schema

6. ETL

6.2. ETL: From one data store to another

7. Data Analysis

Activities of data analysis

  1. Retrieving values
  2. Filter
  3. Compute derived values
  4. Find extremum
  5. Sort
  6. Determine range
  7. Characterize distribution
  8. Find analysis
  9. Cluster
  10. Correlate
  11. Contextualization
  1. https://en.wikipedia.org/wiki/Data_analysis

8. Data Visualization

8.1. Data Visualization

  1. Time-series
  2. Ranking
  3. Part-to-whole
  4. Deviation
  5. Sort
  6. Frequency distribution
  7. Correlation
  8. Nominal comparison
  9. Geographic or geospatial
  1. https://en.wikipedia.org/wiki/Data_visualization

8. Data Visualization

8.2. Data Visualization: Examples

  1. Bar-chart (Nominal comparison)
  2. Pie-chart (part-to-whole)
  3. Histograms (frequency-distribution)
  4. Scatter-plot (correlation)
  5. Network
  6. Line-chart (time-series)
  7. Treemap
  8. Gantt chart
  9. Heatmap

8. Data Visualization

Pie Chart

8. Data Visualization

Programming Language Paradigms (Bubble Chart)

8. Data Visualization

Timeline of Programming Languages (using Histropedia)

8. Data Visualization

Influence Graph of Programming Languages

8. Data Visualization

k Predominant colours

8. Data Visualization

RGB Scatter plots (Comparison)

References

Colors

Images